Watch Tower Insights · Deep dive
One Mile in Six: What Empty Miles and Driver Churn Cost a Small Trucking Fleet
- About one truck-mile in six in the U.S. runs empty, and each one costs the same to drive as a paid mile.
- Running a truck has never cost more per mile, while truckload margins sat below 1 percent in 2025.
- For a small fleet and its drivers, the biggest gains are in the miles and the seats it already has. Here is the arithmetic, with every assumption shown.
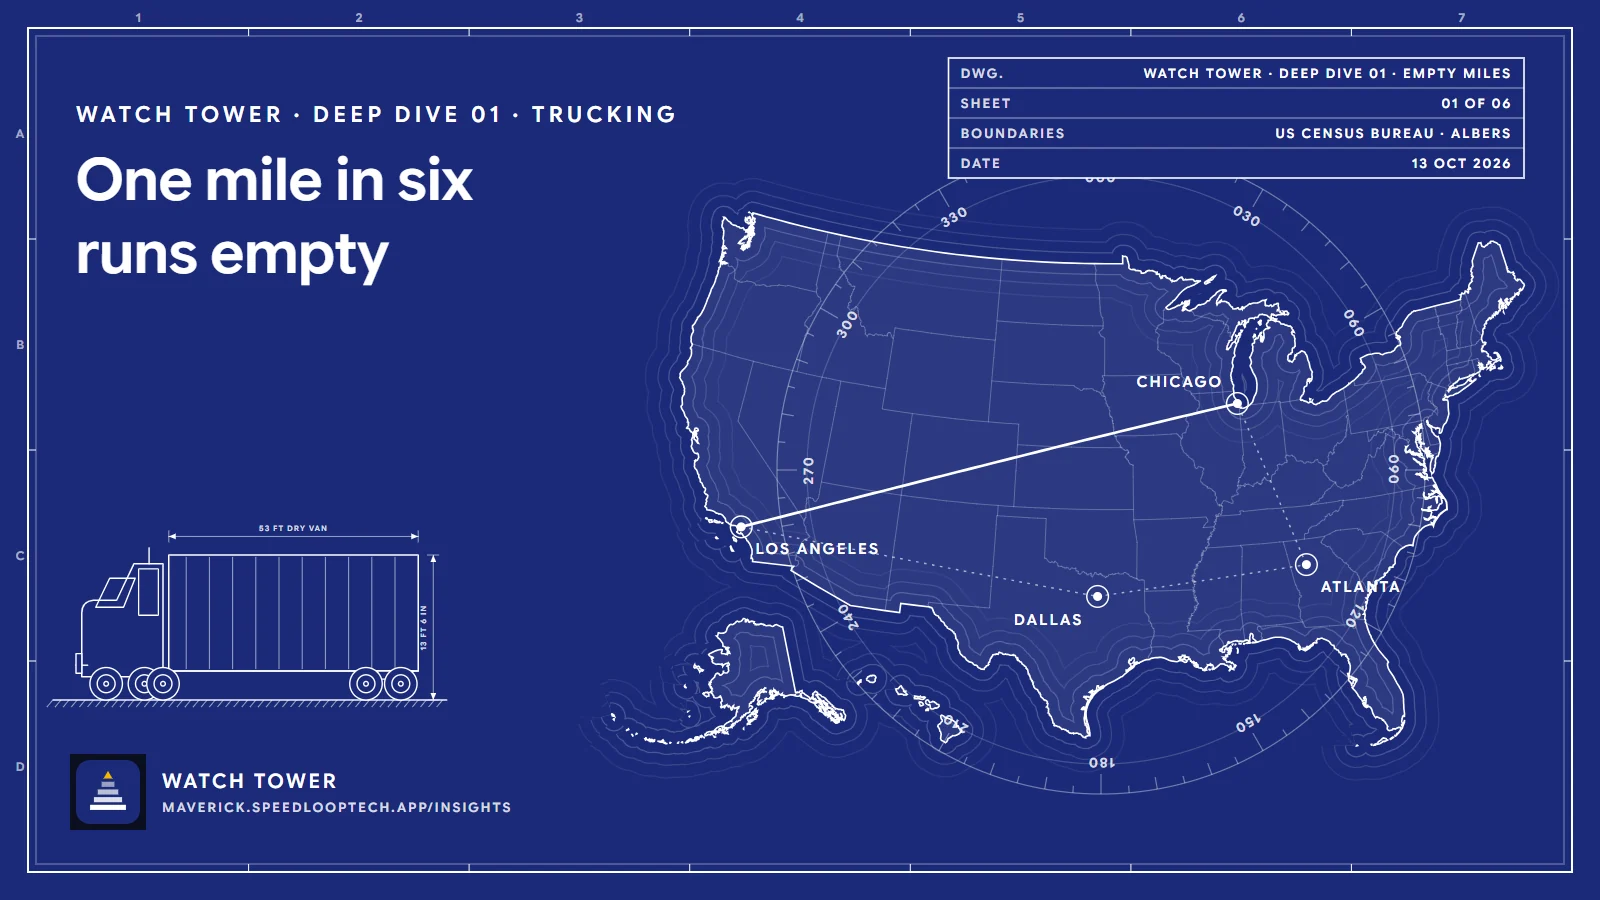
Every trucking company has the same quiet line on its map. A driver drops a load, the trailer is empty, and the truck still has to get somewhere useful: home, the yard, or the next shipper. The fuel burns, the driver is paid, the tires wear and the insurance clock runs. Nobody pays for that mile.
Across the U.S. industry, those unpaid miles averaged 16.7 percent of all miles driven in 2024, up from 16.3 percent the year before, according to the American Transportation Research Institute (ATRI), the research arm of the trucking industry.34 That is roughly one mile in six.
This deep dive looks at what that sixth mile costs a small fleet, why it got more expensive in 2025, and how it connects to the other problem every fleet owner talks about: keeping drivers. Every number has a source in the list at the end. Where we do arithmetic of our own, the assumptions are written next to it so you can swap in your own figures.
Trucking is a small-fleet business
Trucks moved 72.7 percent of all U.S. domestic freight tonnage in 2024, about 11.27 billion tons, according to the American Trucking Associations (ATA).1 It is easy to picture that freight in the trailers of a few national carriers. The carrier count says otherwise.
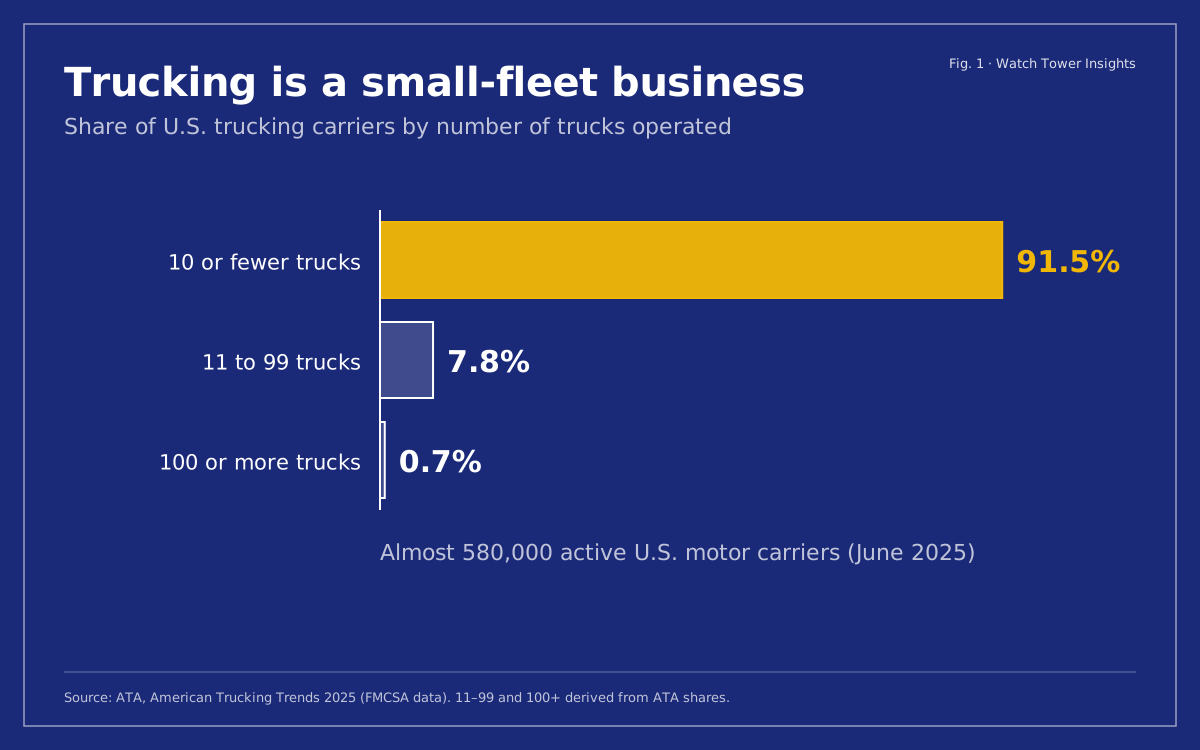
Of the almost 580,000 active U.S. motor carriers counted in June 2025, 91.5 percent operate 10 or fewer trucks, and 99.3 percent operate fewer than 100.1 The typical American trucking company is a family business with a handful of trucks, a dispatcher who may also be the owner, and a spreadsheet, a whiteboard or a load board doing the planning.
That matters for everything that follows. A large carrier has a network team, years of lane history and enough freight density to find a backhaul for most trucks. A five-truck fleet often has none of that. Its empty miles come from the same places, but it has fewer tools to see them coming.


Every mile costs more than it did
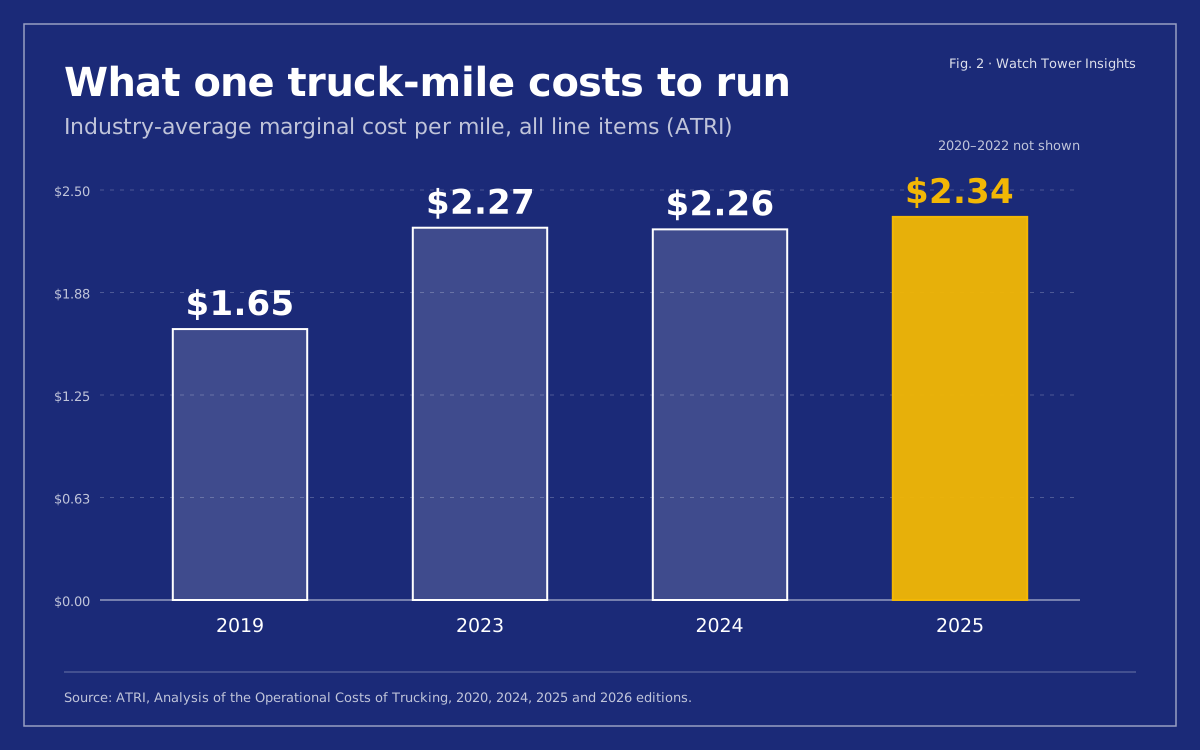
ATRI surveys carriers every year on what it costs to run a truck one mile, counting fuel, driver wages and benefits, truck and trailer payments, repair and maintenance, insurance, permits, tires and tolls. Its 2026 edition puts the industry average at $2.336 per mile in 2025, 3.4 percent more than the $2.260 of 2024 and the highest figure in the study's history.2
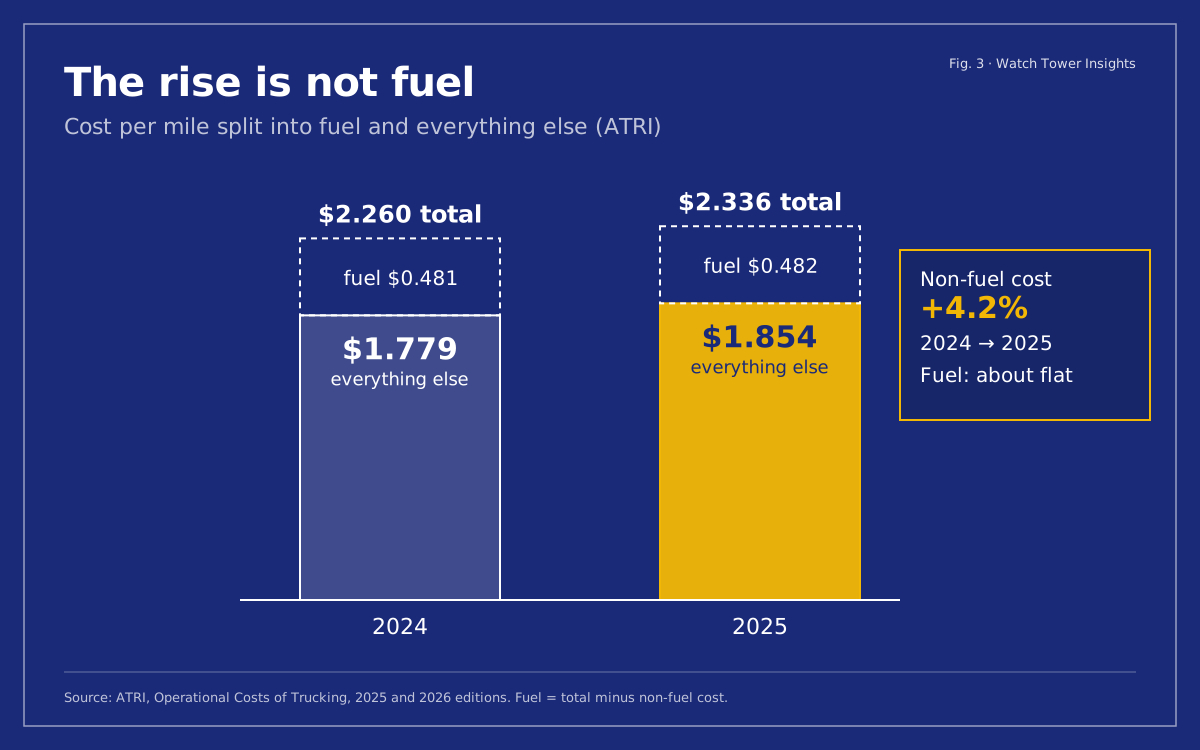
Fuel is usually the first suspect when costs rise, and it is not the culprit this time. Fuel held about flat at roughly 48 cents a mile. Everything else rose 4.2 percent, to $1.854 per mile, which ATRI notes ran ahead of consumer inflation.25
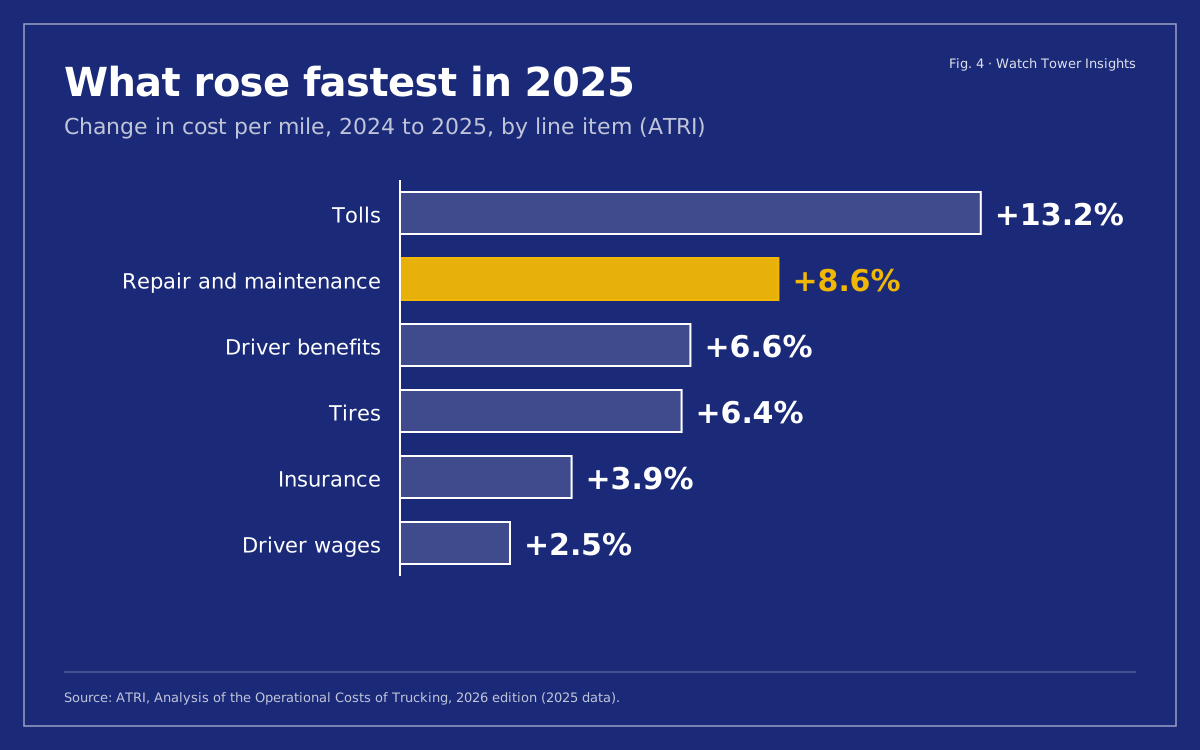
The line items that moved most are the ones a small fleet controls least. In 2025, tolls rose 13.2 percent, repair and maintenance 8.6 percent, driver benefits 6.6 percent and tires 6.4 percent.2 Insurance rose 3.9 percent, to about 10.6 cents a mile, and driver wages rose 2.5 percent, below inflation for the second year in a row.5
Meanwhile, the money coming in did not keep up. ATRI reports that operating margins in the truckload and refrigerated sectors stayed below 1.0 percent in 2025, and flatbed carriers averaged an operating loss of 0.5 percent.2 Carriers responded by shrinking: they cut truck counts by 2.4 percent, the largest reduction since the freight downturn began in 2022.2
When a mile costs more and earns almost nothing, the cheapest mile to fix is the one you already drive and nobody pays for.
One mile in six earns nothing
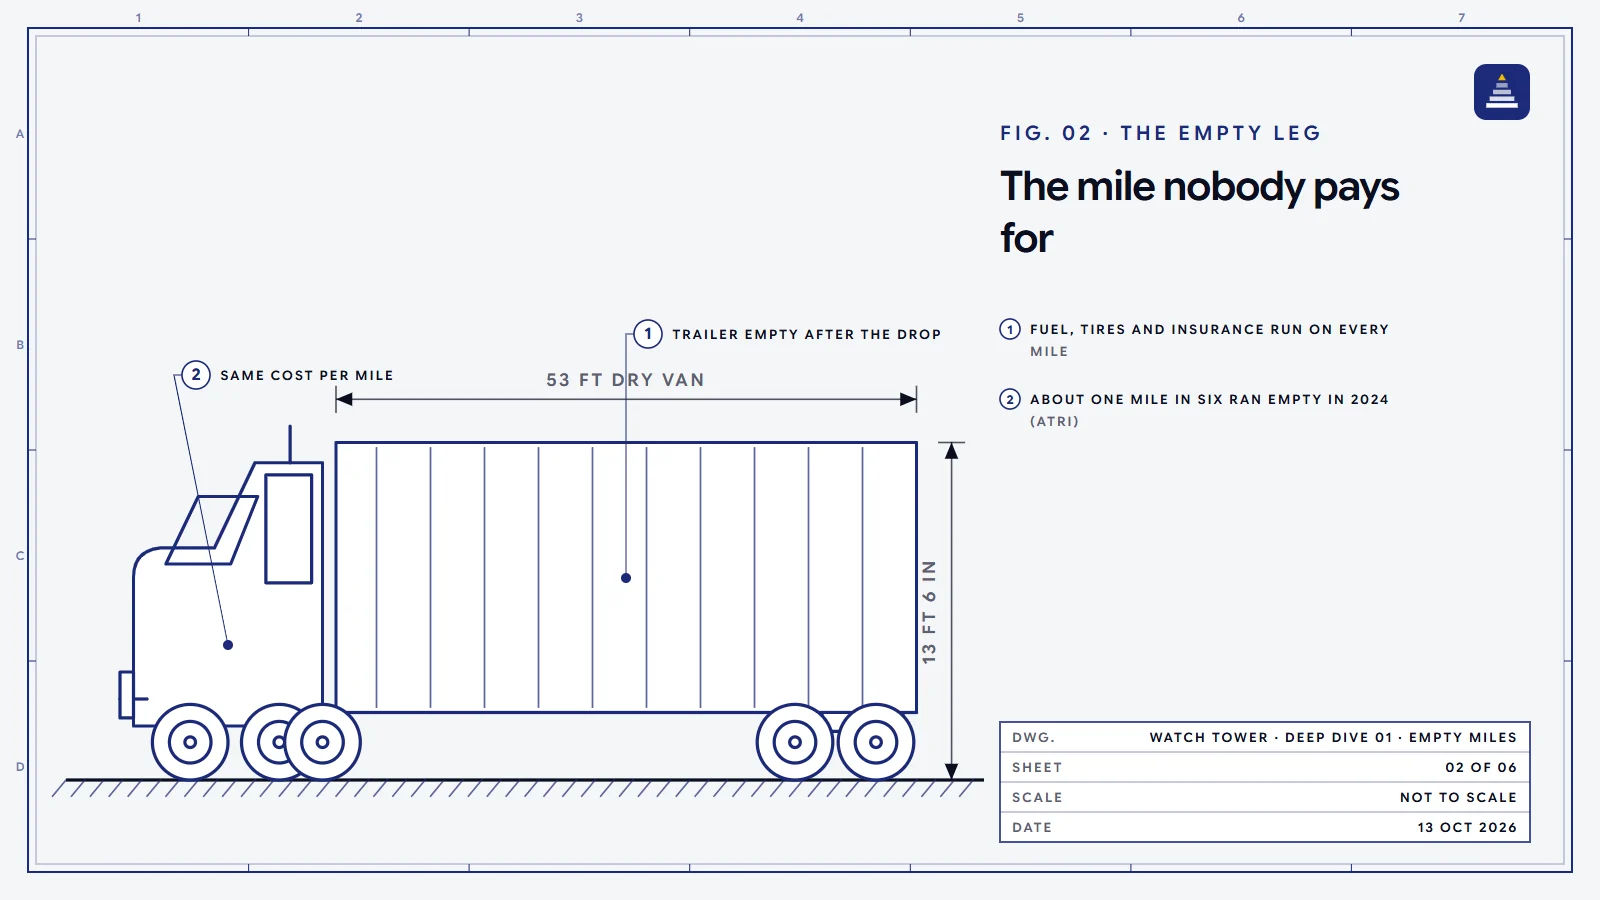
An empty mile, also called a deadhead mile, is any mile a truck drives without a paying load. Some are unavoidable. A reefer that delivers to a grocery warehouse in a city with little outbound freight will drive empty to the next pickup. A driver has to get home. A truck has to reach the shop.
Others come from the way the week was planned. A load is booked for its rate alone, without checking what is near the delivery point. The next load is found after the truck is already empty, so it takes whatever is available within a long drive. A truck goes to the shop from the far end of a lane because the service date was missed. ATRI's averages for 2023 and 2024 show the share rising from 16.3 percent to 16.7 percent, as soft freight demand made backhauls harder to find.34

Here is what that share means for one truck. ATRI's cost per mile is an average across all miles, loaded or empty, so it is a fair estimate of what an empty mile costs to drive. The one number we have to assume is how far the truck runs in a year. We use 100,000 miles because it is a round number for a long-haul truck, not because it is a measured average. Put your own odometer total in its place.
The empty mile for one truck, worked through
| Miles a year (assumption: replace with yours) | 100,000 |
|---|---|
| Share of miles run empty (ATRI, 2024 average)3 | 16.7% |
| Empty miles a year: 100,000 × 16.7% | 16,700 |
| Cost per mile (ATRI, 2025 average)2 | $2.336 |
| Cost of the empty miles: 16,700 × $2.336 | $39,011 |
| Saved by cutting empty miles 1 point (1,000 miles × $2.336) | $2,336 |
This is the cost of driving the empty miles, not a loss figure: some empty miles cannot be avoided, and your own cost per mile may be higher or lower than ATRI's average.
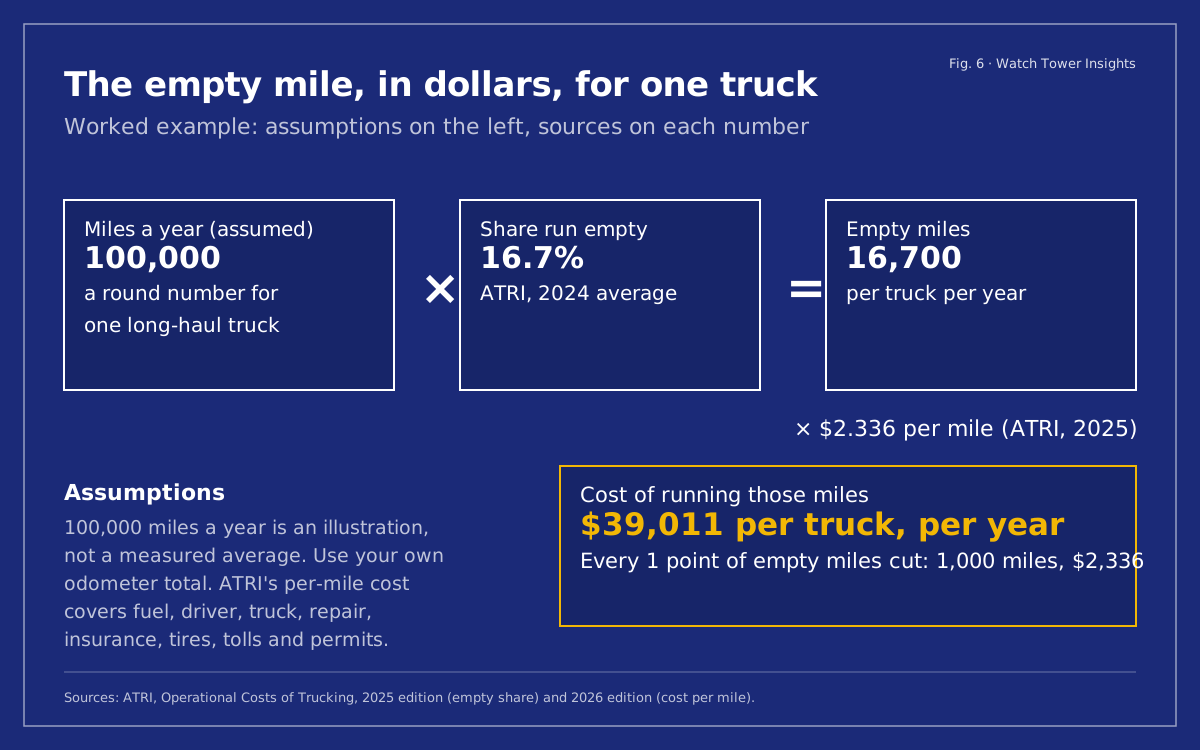
No fleet will take that number to zero, and nobody should promise to. The useful number is the last row. Each point of empty miles a fleet removes is about 1,000 miles and $2,336 of cost per truck per year, on the assumptions above. For a 10-truck fleet, one point is about $23,360 a year.
Why one point matters when margins are thin
Cost avoided goes straight to the bottom line. New revenue does not: most of it is spent again on the miles needed to haul it. With truckload margins under 1 percent in 2025,2 the comparison is stark.
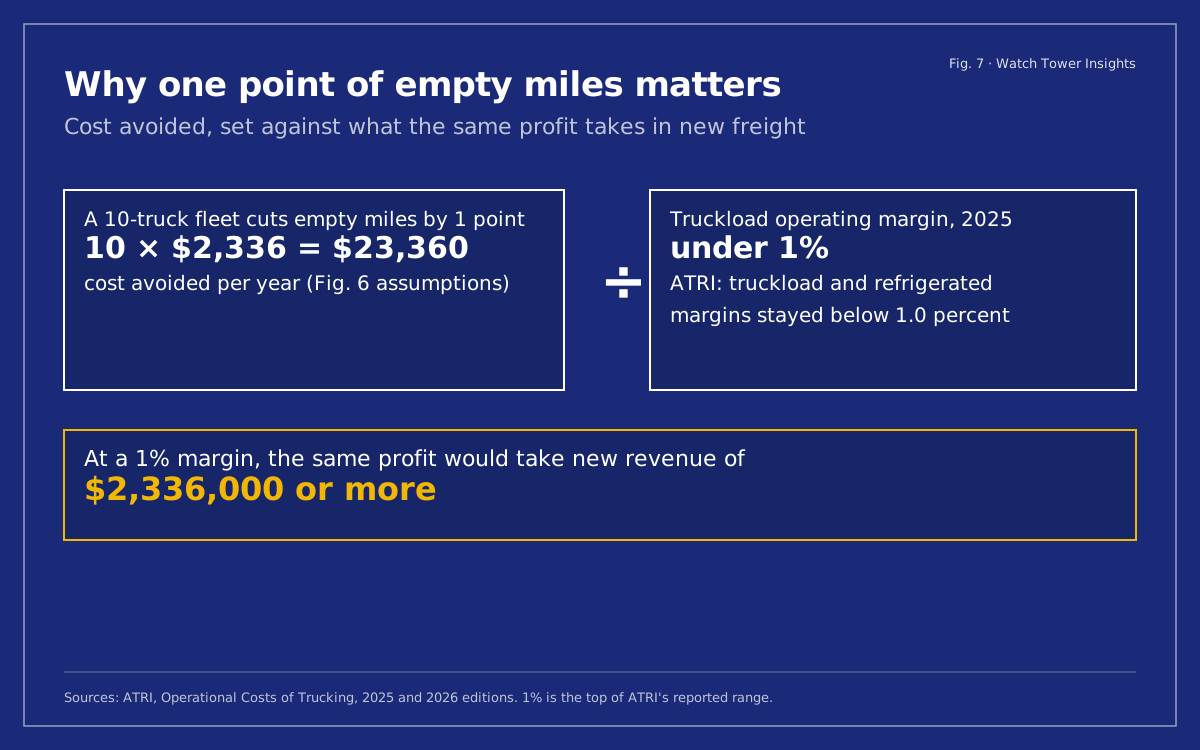
At a 1 percent margin, earning an extra $23,360 of profit takes $2.336 million of new revenue. At a lower margin it takes more. That does not mean a fleet should stop selling; it means the miles it already drives deserve the same attention as the next customer. A small fleet can rarely add two million dollars of freight in a year. It can often look harder at where its trucks go after each drop.

The seat problem: drivers who leave
The second cost sits in the cab. ATRI puts driver turnover across carriers at 44.2 percent in 2025, down from 48 percent a year earlier as a softer freight market made drivers less likely to switch jobs.5 The rate depends heavily on the kind of fleet: 70.7 percent at truckload carriers with more than 1,000 trucks, and 32 percent at fleets with fewer than 26 trucks.5
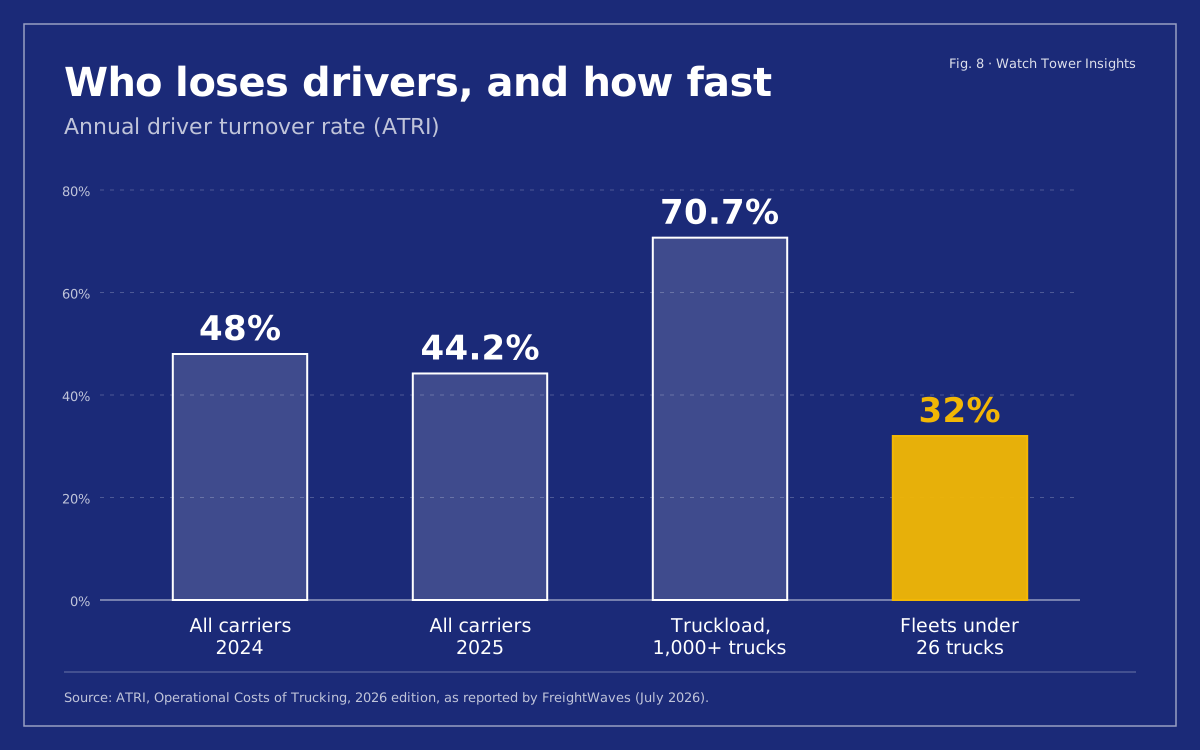
Small fleets do better than the giants here, and that is worth saying plainly: a driver who knows the owner by name and gets home on a predictable schedule tends to stay. But 32 percent still means that a 10-driver fleet replaces about three drivers a year. Each replacement means recruiting, checks, orientation and weeks when a truck may sit without a driver. ATRI's 2025 edition recorded 0.93 drivers per truck across the fleets it surveyed in 2024, as carriers parked trucks they could not seat or did not need.3
The pool of drivers is large but busy. The Bureau of Labor Statistics counts about 2.24 million heavy and tractor-trailer truck driver jobs in 2024, with a median wage of $57,440, and projects about 237,600 openings a year on average through 2034, most of them to replace drivers who leave the job or retire.6 Every one of those openings is a fleet somewhere trying to fill a seat.
Empty miles and turnover are connected. Depending on how a fleet pays for empty miles, a long empty leg can mean less pay for a driver paid by the mile, and an unplanned week is the one that keeps a driver from getting home. A dispatch plan that cuts deadhead also tends to make a driver's week more predictable. We have not found a public dataset that measures that link directly, so treat it as a plain observation, not a finding.
.jpg)
What this means for the people
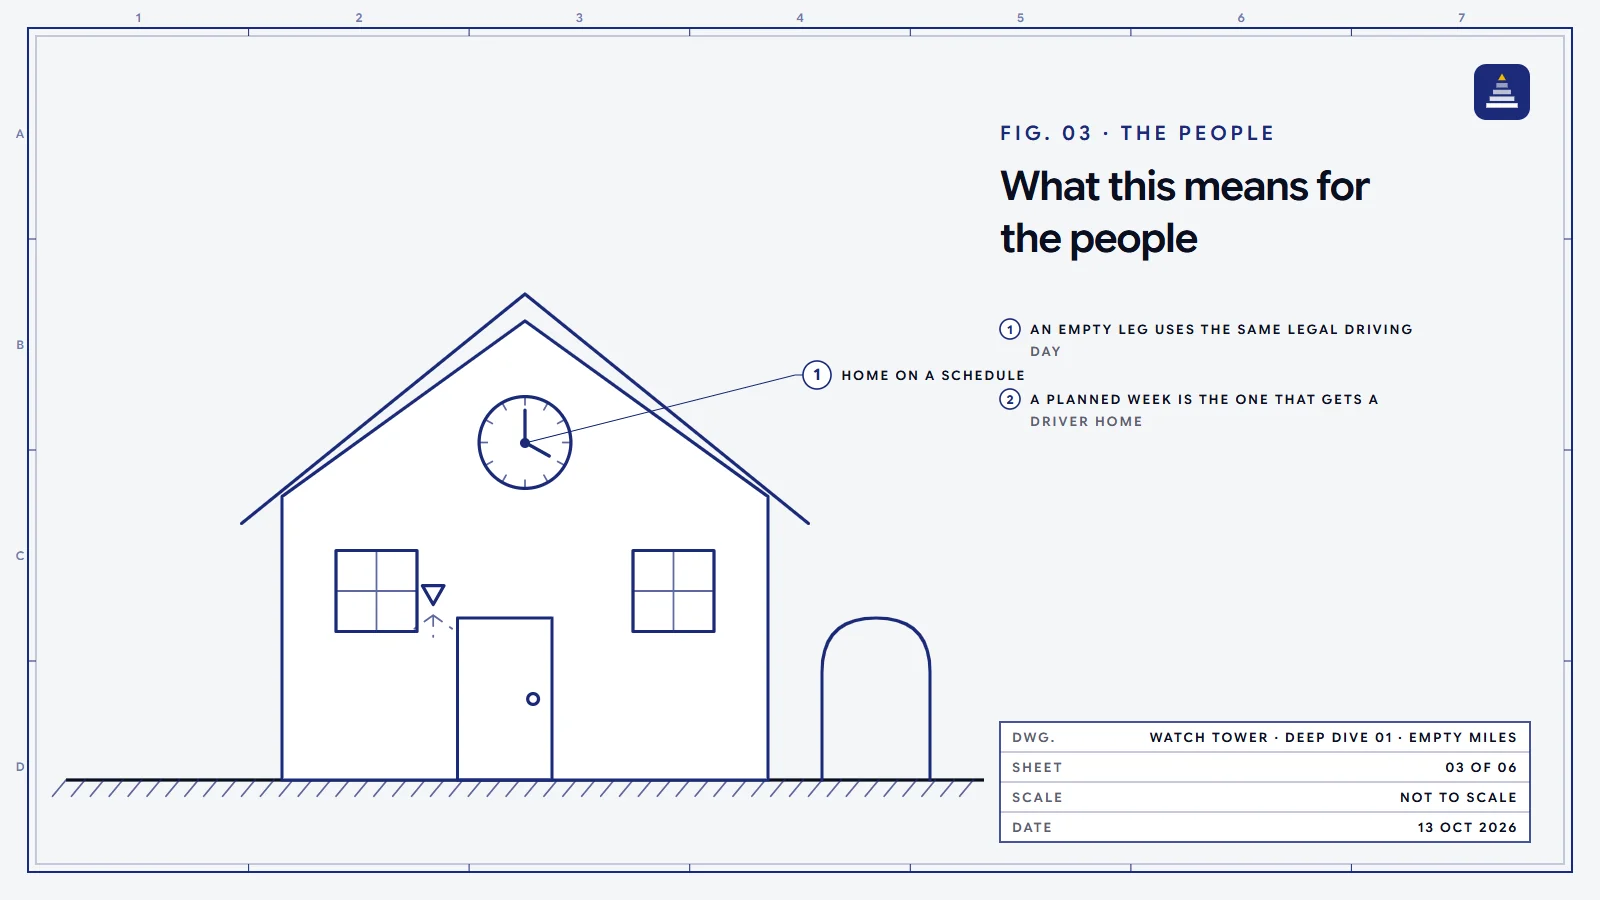
Behind every empty mile is a person at the wheel. Federal hours-of-service rules allow a property-carrying driver up to 11 hours of driving within a 14-hour window after coming on duty.8 An hour driven empty uses that legal day just as a loaded hour does. It is time away from home, on the road, moving no freight that pays for the trip.
Pay makes it sharper. The median heavy-truck driver earned $57,440 in 2024,6 and driver wages rose 2.5 percent in 2025, below inflation for the second year running.5 Fleets pay for empty miles in different ways, but the cost of an unpaid mile always lands in someone's week: the driver's, the owner's, or both.
For the owner of a five-truck fleet, who often dispatches, keeps the books and drives too, the stakes are personal. The margin on the next load is the household's income. Customers feel it as well: when carriers park trucks to get through a hard year, as they did in 2025 by cutting truck counts 2.4 percent,2 shippers have fewer trucks to call.
None of this is anyone's fault. Drivers don't choose where the freight is, and owners don't set the market rate. The empty leg is a planning problem, and planning is something a fleet can change.

What this means for the business
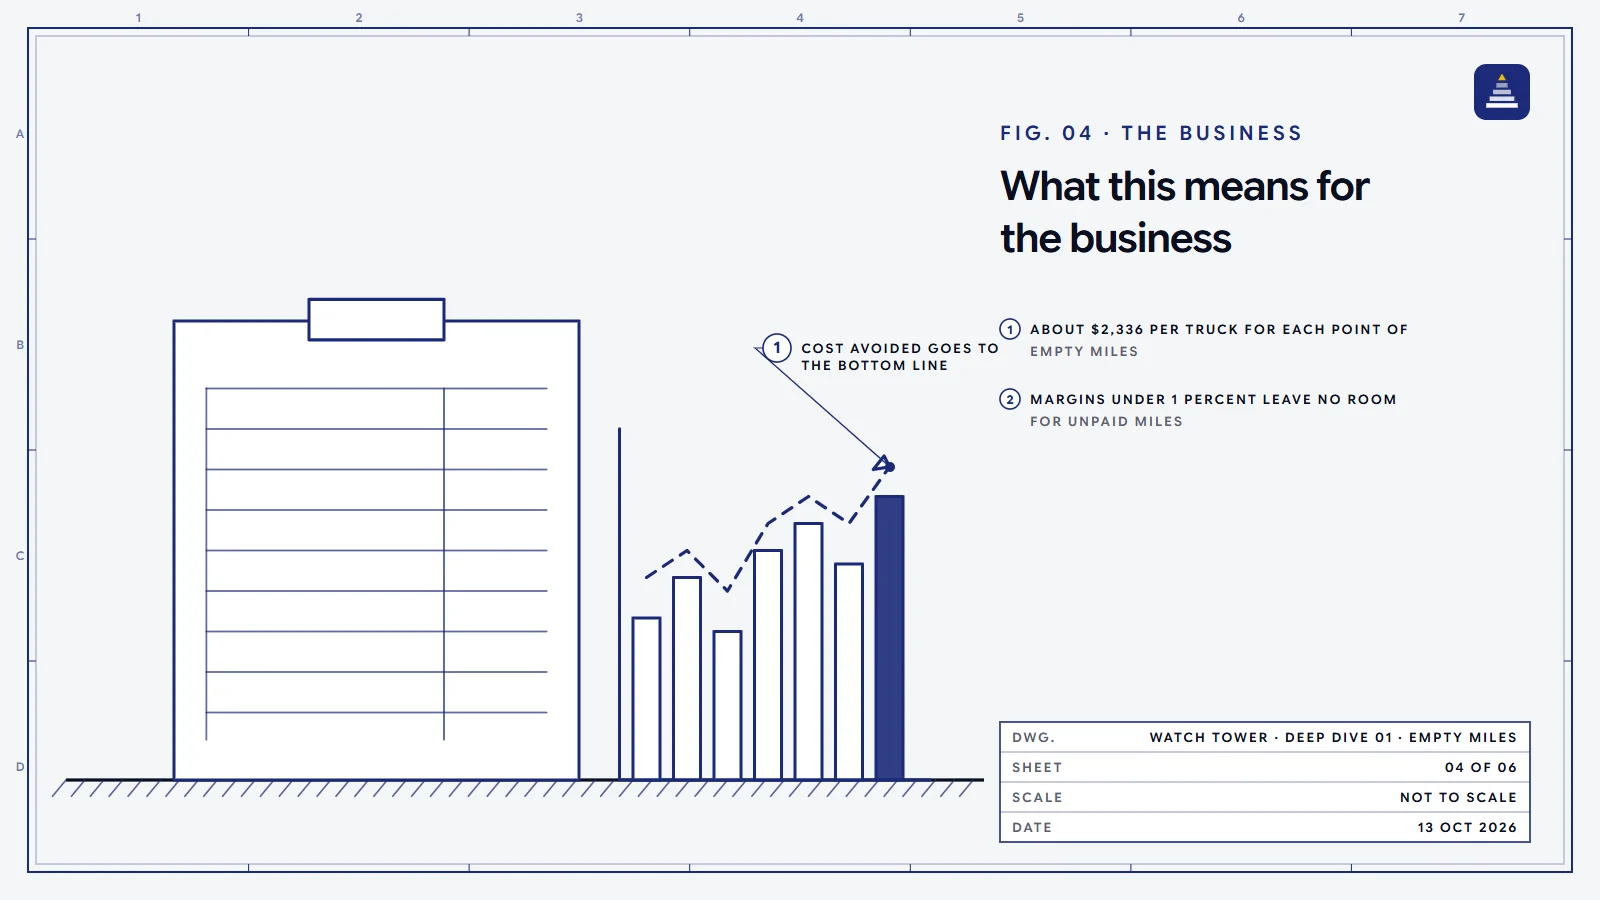
For the business, an empty mile is a cost with nothing on the other side of the ledger. On ATRI's averages and our stated assumption of 100,000 miles a year, the empty miles on one truck cost about $39,011 a year to drive.23 Each point a fleet removes is about $2,336 per truck, or $23,360 across ten trucks.
Thin margins make that money matter more. With truckload operating margins below 1 percent in 2025,2 a dollar of cost avoided is worth far more than a dollar of new revenue. Drivers are part of the same sum: with turnover at 32 percent in fleets under 26 trucks,5 every driver who stays saves the cost of recruiting, checks and orientation, and keeps a truck from sitting without a driver.
The business case and the people case point the same way. A planned week with fewer empty legs is cheaper to run, and it is also the week that gets a driver home on time.

_(52030164780).jpg)
What brings empty miles down
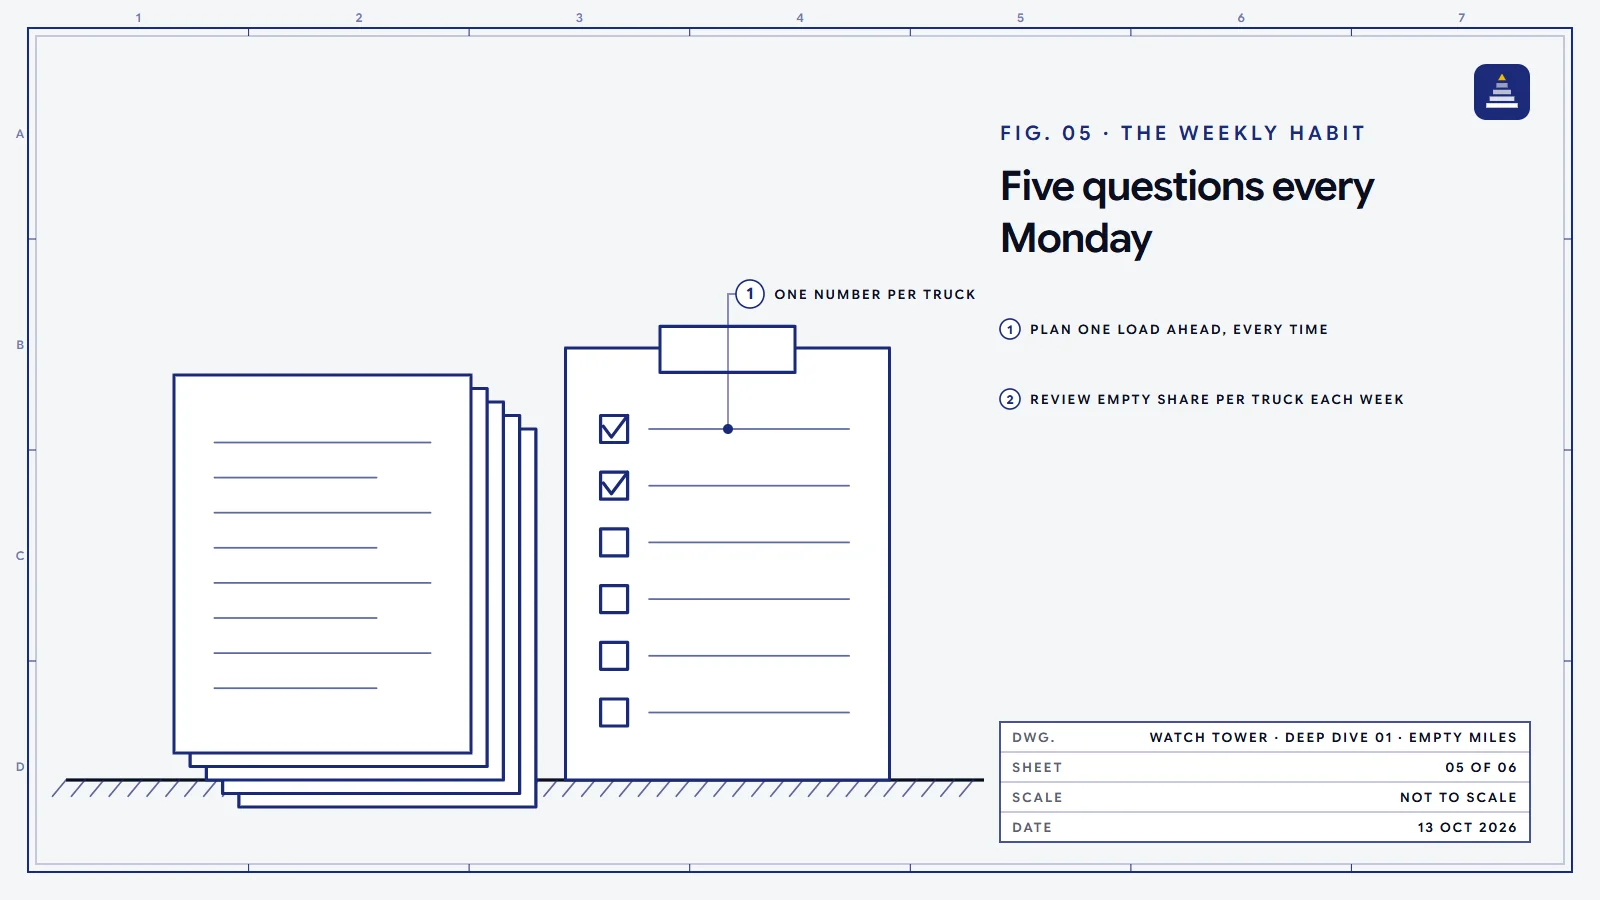
None of the following is new. What usually goes wrong is that each habit depends on someone remembering it every day, on a day already full of phone calls. These are the practices fleets and freight planners use, written as the questions a dispatcher can ask each week:
- Where does this load leave the truck? Before booking, check what freight leaves the delivery area, not just what this load pays. A slightly lower rate with a backhaul waiting can beat a higher rate into a dead zone.
- Which lanes keep coming back? Most small fleets run a few repeat lanes. A list of the shippers near each regular delivery point turns a backhaul search into a phone call.
- Is the next load booked before this one delivers? Searching after the drop means taking what is left. Planning one load ahead, every time, is the single habit that most changes empty miles.
- When is each truck due for service, and where will it be? Routing a truck toward the shop on its last loaded leg avoids a separate empty trip.
- What was last week's empty share, per truck? A number nobody looks at does not move. One figure per truck, reviewed every Monday, shows which trucks and lanes need attention.
The last question is the one that holds the others together. Empty miles are not a project you finish; they come back as soon as the weekly review stops. That is a consistency problem, and it is where most fleets lose ground.
Where Applied Intelligence fits
At Norventus we call this Applied Intelligence: AI put to work inside a system, with a team behind it, until it pays off every day. For a trucking fleet the goal comes first, and here it is concrete: fewer empty miles per truck and fewer empty seats. The use is just as specific. It means pulling each truck's loaded and empty miles from the records the fleet already keeps, such as load sheets, fuel cards and ELD exports, and putting them in one weekly picture.
The system matters more than the model. A useful setup reads last week's loads, works out the empty share per truck and per lane, lists the repeat shippers near each delivery point, and flags trucks due for service along with where they will be. It then puts all that in front of the dispatcher every Monday, with the assumptions behind every figure visible. The return path is what makes it stick: the same review, the same numbers, every week, so a fleet can see whether one point of empty miles actually came off.
That is the barrier most fleets face. Few doubt the problem, and many have tried a tool. What fades is the habit. A plan that runs every week, with someone to call when it stops making sense, is what turns a good month into a good year.
The takeaway
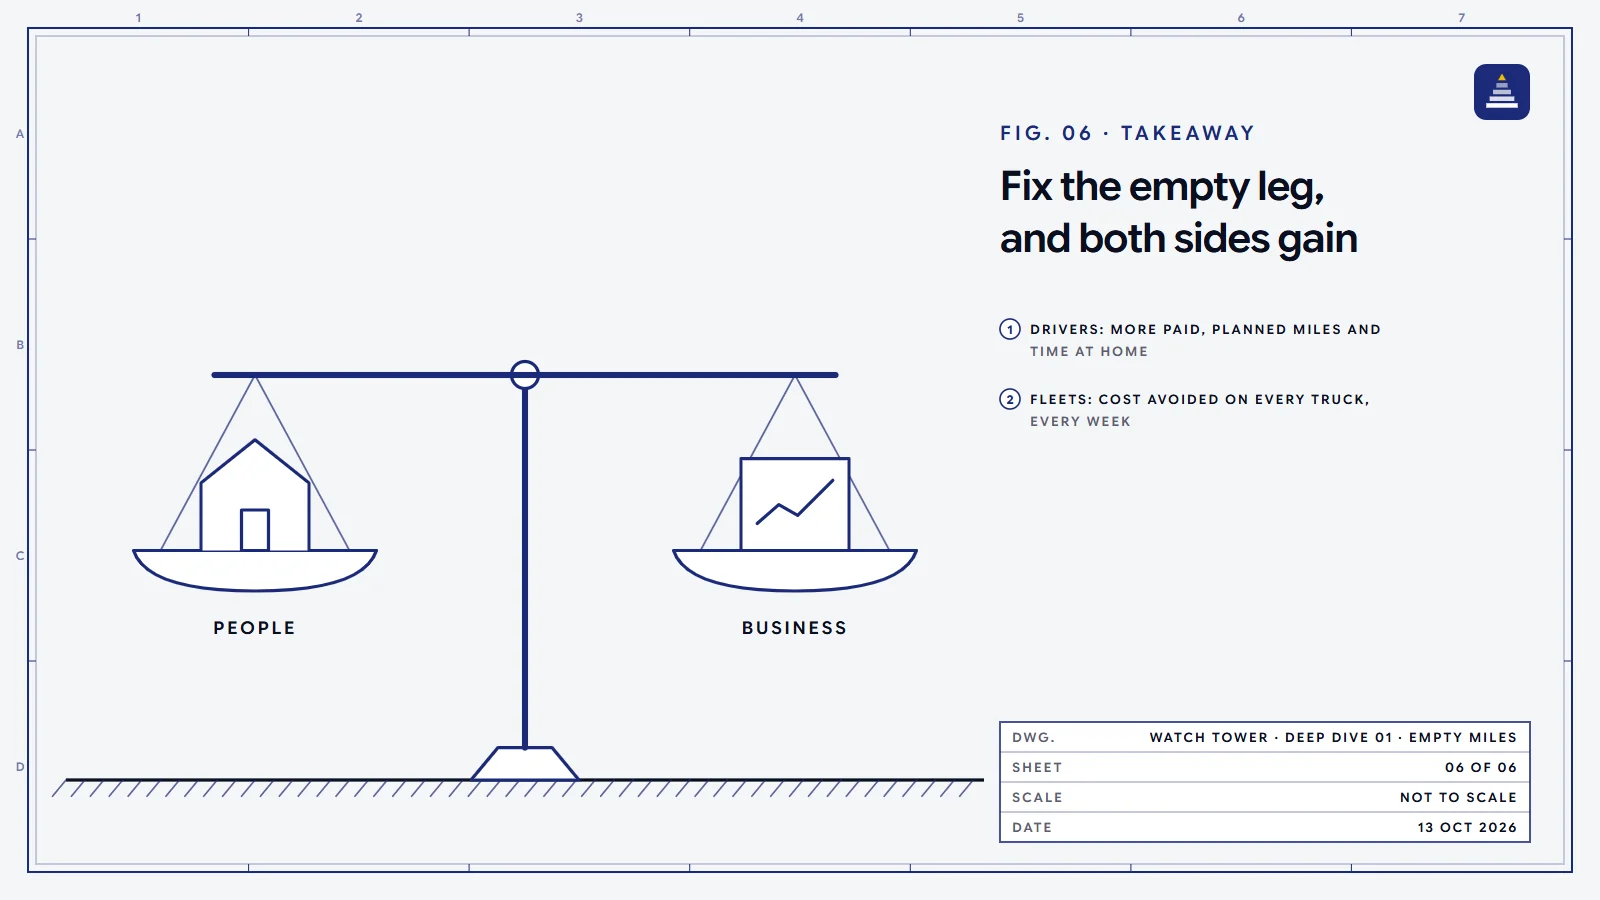
- Both sides gain from the same fix. Fewer empty legs mean drivers spend more of their legal driving day on planned, paid freight and get home on a schedule they can count on, and the fleet avoids about $2,336 of cost per truck for each point it removes.238
- About one truck-mile in six in the U.S. runs empty (16.7 percent in 2024), and each one costs about the same to drive as a paid mile.3
- A truck-mile cost $2.336 to run in 2025, a record, and the rise came from everything except fuel.2
- With truckload margins under 1 percent, one point of empty miles on a 10-truck fleet (about $23,360 a year on our stated assumptions) is worth more than $2.3 million of new freight.2
- Small fleets keep drivers longer than the largest carriers, but still replaced about a third of them in 2025.5
- The fix is a weekly habit: plan one load ahead, know your repeat lanes, route service stops into loaded legs, and review empty share per truck every Monday.
Sources
- American Trucking Associations, American Trucking Trends 2025 (freight tonnage share, tons hauled, carrier count and fleet-size shares). www.trucking.org/news-insights/ata-american-trucking-trends-2025
- ATRI, "New ATRI Report Details Accelerating Costs and Low Profitability Despite Cuts" (Analysis of the Operational Costs of Trucking, 2026 edition, 2025 data), July 2026. truckingresearch.org/2026/07/new-atri-report-details-accelerating-costs-and-low-profitability-despite-cuts/
- ATRI, "New ATRI Report Shows Trucking Profitability Severely Squeezed by High Costs, Low Rates" (2025 edition, 2024 data: empty miles 16.7%, 0.93 drivers per truck), July 2025. truckingresearch.org/2025/07/new-atri-report-shows-trucking-profitability-severly-squeezed-by-high-costs-low-rates/
- ATRI, "New ATRI Research: Industry Costs Increased More than 6 Percent During Freight Recession" (2024 edition, 2023 data: cost per mile, deadhead 16.3%), June 2024. truckingresearch.org/2024/06/new-atri-research-industry-costs-increased-more-than-6-percent-during-freight-recession/
- FreightWaves, "Trucking costs outpaced consumer inflation in '25: ATRI" (driver turnover by fleet type, wages, insurance), July 2026. www.freightwaves.com/news/trucking-costs-outpaced-consumer-inflation-in-25-atri
- U.S. Bureau of Labor Statistics, Occupational Outlook Handbook: Heavy and Tractor-trailer Truck Drivers (2024 jobs, May 2024 median pay, 2024–34 openings). www.bls.gov/ooh/transportation-and-material-moving/heavy-and-tractor-trailer-truck-drivers.htm
- ATRI, Operational Costs of Trucking research series (all editions; 2019 cost per mile from the 2020 edition). truckingresearch.org/about-atri/atri-research/operational-costs-of-trucking/
- Federal Motor Carrier Safety Administration, Summary of Hours of Service Regulations (property-carrying drivers: 11-hour driving limit, 14-hour window). www.fmcsa.dot.gov/regulations/hours-of-service/summary-hours-service-regulations
Method: figures are copied from the sources above, by year as each source reports them. Where we calculate, the inputs and assumptions are shown next to the result. Charts are our own drawings of the cited data.