All four samplesDownload the PDF

Applied Intelligence briefApplied Intelligence for your Business

Illustrative sample · fictional company and figures · not a real customer

Regional trucking and 3PL · Line-haul: lanes, trucks and drivers

Lone Star Freight & Logistics (fictional)

The goal Reduce losses: Empty-mile ratio · today 18.1% (Q3 2026) · target 15% within two quarters

Must not get worse On-time delivery ≥ 90%; no hours-of-service violations

Records as of September 30, 2026 · Decision owner: Owner and operations manager

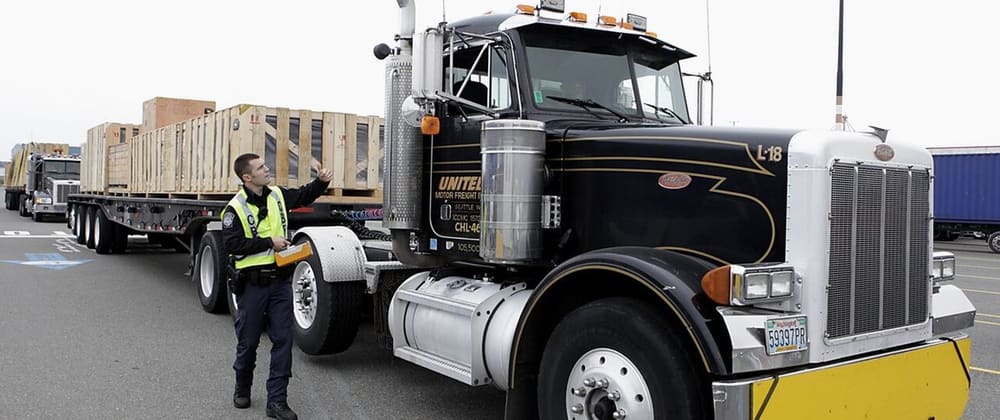
An officer in a safety vest signals a flatbed truck through an inspection station in Seattle, Washington.

Company snapshot

Base
Dallas, TexasCompany profile
People
140 employeesCompany profile
Operating area
Dallas–Fort Worth, Waco and HoustonIntake interview
Sites
Dallas terminal (HQ) · Fort Worth cross-dock · Houston warehouse · Waco relay yardAsset register
Fleet
41 tractors, 27 trailers and yard unitsFleet and asset register
Billed, Q3 2026
$11,007,800: line-haul 4,380 loads × $1,910 = $8,365,800 (76%), warehousing $2,642,000 (24%)TMS quarterly export (fictional)
Sells
Truckload (dry van and reefer) · LTL consolidation · Cross-dock and warehousingIntake interview
Records we used
TMS load history (two quarters) · ELD positions and hours · Maintenance spreadsheetIntake interview

The three biggest findings, in dollars

1

Opportunity

Backhaul partnership on Houston–Dallas

$20,450 a month

How it adds up: 43.3 backhauls a month × $472 net ($576 revenue − $104 extra cost)

  • Inputs (Q3 2026): 32 Houston round trips a week; 25 of the 32 returns run empty, 240 miles each.
  • Assumed fill: 40% = 10 backhauls a week.
  • Per backhaul: 240 loaded miles × $2.40 a mile = $576, less $104 extra cost (out-of-route miles $30, fuel running loaded $18, loading pay $56) = $472 net.
  • Monthly: 10 × 52 ÷ 12 = 43.3 backhauls × $472 = about $20,450.
  • Empty-mile ratio would fall from 18.1% to about 14.9%.
  • 8 of the 41 tractors already run Dallas–Houston, about 4 round trips a week each. No trucks added.
  • Payback: $4,746 one-off ÷ $20,450 a month = 0.23 months.

Source: Entered in the console (fictional) · reported

2

Money leaking

Truck cost per mile up since Q2 2026

$59,280 a quarter≈ $19,760 a month

How it adds up: ($2.00 − $1.94) × 988,000 miles (Q3 2026)

  • Q3 2026: 41 tractors, about 38 seated, × about 2,000 miles a week × 13 weeks = 988,000 miles.
  • Fuel: 988,000 ÷ 6.8 mpg = 145,294 gallons × $3.74 = $543,400 ($0.55 a mile).
  • Driver: $0.62 a mile pay + $0.16 benefits and payroll tax = $0.78.
  • Maintenance and tires: $0.21.
  • Truck and trailer payments and insurance: $0.46.
  • Total $1,976,000 ÷ 988,000 = $2.00 a mile.
  • Q2 2026: $1.94 (diesel $3.47 = $0.51 a mile; maintenance $0.19).

Source: Fuel card, payroll and maintenance exports (fictional) · reported · First test: Backhaul partnership on Houston–Dallas

3

Money leaking

Empty-mile ratio up since Q2 2026

$25,688 a quarter≈ $8,563 a month

How it adds up: (18.1% − 16.8%) × 988,000 miles = 12,844 × $2.00

  • Q3 2026: 178,828 empty of 988,000 miles = 18.1%; Q2 2026: 16.8%.
  • Each extra empty mile is priced at the $2.00 truck cost per mile (Q3 2026 record).
  • Houston returns are 44% of the empty miles.

Source: TMS quarterly export (fictional) · documented · First test: Backhaul partnership on Houston–Dallas

The findings can overlap, so they aren't added together.

Where you are, where you could go

San AntonioOklahoma CityMemphisDallas terminalFort Worth cross-dockWaco relay yardHouston warehouse

Where you are Where you could go next Lines beyond the US

The sample company's places (a fictional company, real towns). The white lines are directions to test, not forecasts.
4 places on the map
The sample company's places (a fictional company, real towns)
233 mi across your places today
Straight line from Fort Worth cross-dock to Houston warehouse
421 mi to the farthest next place
Straight line from Dallas terminal to Memphis: a direction to test, not a forecast
$245,400 a year from the biggest finding
$20,450 a month × 12, if "Backhaul partnership on Houston–Dallas" holds for a year; the findings overlap, so they aren't added

Where the work could go next

  1. San Antonio The next I-35 lane past the Waco relay yard
  2. Oklahoma City I-35 north: freight to fill the empty legs back into Dallas
  3. Memphis I-40 east to a national freight hub

Lone Star Freight & Logistics · Applied Intelligence brief

KPI board

Truck cost per mile

$2.00from $1.94

▼ Worse · Q2 2026 → Q3 2026

Fuel, driver pay and benefits, maintenance and tires, and truck and trailer payments and insurance, divided by every mile company trucks drove.

Q3 2026: 41 tractors, about 38 seated, × about 2,000 miles a week × 13 weeks = 988,000 miles.

Fuel card, payroll and maintenance exports (fictional) · reported

Empty-mile ratio

18.1%from 16.8%

▼ Worse · Q2 2026 → Q3 2026

Miles driven without a load as a share of all miles. Guardrail.

Q3 2026: 178,828 empty of 988,000 miles = 18.1%; Q2 2026: 16.8%.

TMS quarterly export (fictional) · documented

On-time delivery

89.4%from 91.2%

▼ Worse · Q2 2026 → Q3 2026

Deliveries inside the appointment window. Guardrail.

TMS quarterly export (fictional) · documented

Detention per stop

2.6 hfrom 2.1 h

▼ Worse · Q2 2026 → Q3 2026

Average hours waiting at docks beyond two free hours. Guardrail.

TMS quarterly export (fictional) · reported

Revenue per load

$1,910from $1,850

▲ Better · Q2 2026 → Q3 2026

Line-haul revenue divided by loads delivered.

Q3 2026: 4,380 loads × $1,910 = $8,365,800 of line-haul revenue.

TMS quarterly export (fictional) · documented

Loads delivered

4,380from 4,120

▲ Better · Q2 2026 → Q3 2026

Company-truck and brokered loads delivered in the quarter.

TMS quarterly export (fictional) · documented

The 30-day plan: who does what

WeekWatch Tower (your Console)The Norventus teamYou
Week 1Records in, goal agreedLoads TMS load history (two quarters) and ELD positions and hours into your workspace, and builds the KPI board: Truck cost per mile, Empty-mile ratio, On-time delivery.Kickoff with the operations manager: agree the goal and check the inputs behind "Backhaul partnership on Houston–Dallas".Name one owner and send the records you have; tell us whether dock appointment times by shipper exist anywhere.
Week 2Findings checked, pilot writtenFlags "truck waiting over 2 hours at a dock" as soon as your records show it.Writes the pilot for "Backhaul partnership on Houston–Dallas", with its gate: go if empty miles −3 points and on-time ≥ 90%.Correct any input that doesn't match how the work really runs.
Week 3On the map, cards movingPuts your 4 sites and assets on one US map, and opens a work card for each pilot step, with an owner.Sets up the "Monday lane review" (weekly) around the KPI board.Pre-book backhauls and track detention by dock on the Houston lane.
Week 4First weekly reviewRe-measures the findings and writes your week-4 brief, with every input shown.Runs the first weekly review with you, and stays on it every week after.Decide go, revise or stop at the "Lane pilot gate" (operations manager, 15 Jan 2027).

How Watch Tower runs this

The same records, in the Console your team uses every week. Drawn here from this brief's records (fictional).

Console · Home

This quarter's goal

Reduce losses: Empty-mile ratio · today 18.1% (Q3 2026) · target 15% within two quarters

Truck cost per mile$2.00▼ worse from $1.94
Empty-mile ratio18.1%▼ worse from 16.8%
On-time delivery89.4%▼ worse from 91.2%
Biggest findingBackhaul partnership on Houston–Dallas$20,450 a month
Console Home: the goal, the KPI board and the biggest finding, checked every week.

Talos · Map

1234100 mi
  1. 1Dallas terminal
  2. 2Fort Worth cross-dock
  3. 3Waco relay yard
  4. 4Houston warehouse
Talos: every place on one map, zoomed to your region, with county lines and a scale.

Atlas · Discover

NeedKeep cost per mile down on the new lane

  • Redwater Fuel DeliveryExample listing

    On-site fuel delivery

    Overnight wet-hosing of diesel and DEF at your yard so trucks leave full in the morning.

    Ask for a quote
  • Bluestem Tire & RetreadExample listing

    Tire service

    Commercial tire sales, retreads and 24-hour road service for fleets running regional lanes.

    Ask for a quote
  • Mesa Ridge Mobile Truck RepairExample listing

    Mobile truck repair

    Roadside and yard repair for Class 8 tractors and trailers: brakes, air systems, electrical and DOT pre-inspection fixes.

    Ask for a quote
Atlas Discover: suppliers and services for the biggest finding. These are example listings, not endorsements.

Work Tracker

This week 1

Week 1 · Records in, goal agreed

Name one owner and send the records you have; tell us whether dock appointment times by shipper exist anywhere.

Owner: you · with the Norventus team

Next week 1

Week 2 · Findings checked, pilot written

Correct any input that doesn't match how the work really runs.

Owner: you · with the Norventus team

Later 2

Week 3 · On the map, cards moving

Pre-book backhauls and track detention by dock on the Houston lane.

Owner: you · with the Norventus team

Week 4 · First weekly review

Decide go, revise or stop at the "Lane pilot gate" (operations manager, 15 Jan 2027).

Owner: you · with the Norventus team

The Work Tracker: the 30-day plan as cards, one owner each, moved on every week.

The next step

Decision on the table: Run a 90-day Houston–Dallas backhaul pilot from 1 November, owned by the operations manager. Review: 15 Jan 2027.

Go: Empty miles −3 points and on-time ≥ 90% · Stop: No change or on-time below 88%

Records that would sharpen these numbers: Dock appointment times by shipper · Fuel card spend linked to loads

Start on Know your business: your own workspace and your first brief within four weeks. Every plan and price is on /pricing.

Questions: Adi, COO at Norventus · maverick.speedlooptech.app